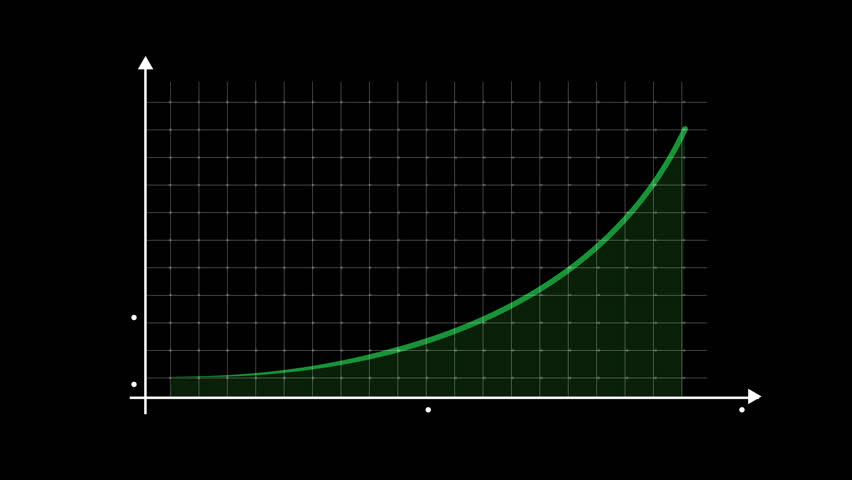
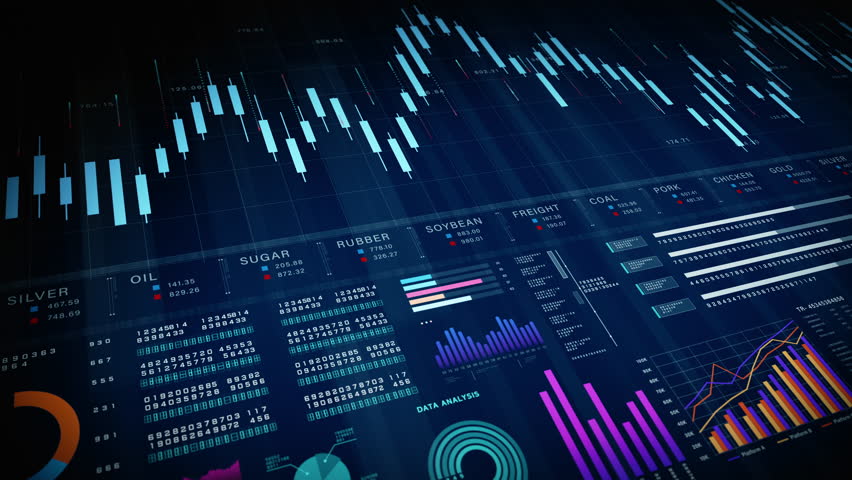
Download Infographic Graphs Toolkits February 22, 2021 Infographics Resolution 1920 x 1080 File Size 3.2MB https://video-previews.elements.envatousercontent.com/h264-video-previews/39cbac2f-3230-4624-bedc-5eb9ef1db628/26669281.mp4 Download2 Download Buy it Download Disable Redirection Upgrade your account to disable redirection. AIVideoGen BETA Generate immersive scenes with the latest AI models. 16:9 Aspect ratio 16:9 9:16 Sound Speech Generate 5 Digital blue bar chart with growing business concept 2d Animation Infographic increase graph analysis chart diagram strategy, bar chart concept data corporation with alpha channel or transparent background High-tech global data dashboard with blue analytics, bar graphs, world map visuals, and advanced statistics. Perfect for technology. and Business and financial investment strategy, background 4k Advanced data analytics dashboard display. Business and financial investment. HUD infographic of financial. Information reports of business strategy for investment. Technology data analysis. Financial data document graph chart report statistic Data analytics AI technology. Big data, business artificial intelligence marketing research planning strategy analysis business technology hologram Seedling growing from soil monitored with futuristic technology Digital stock market dashboard with analytics, commodity prices, and candlestick chart for investment and trading analysis, Financial investment concept background Financial data charts and graphs. Infographic, analytics, marketing, technology, finance, statistics. world map 3D animation strategy for global business statistics investment, trends, Stock market 4K Infographic Graphs Toolkits- After Effect Template +5 Infographic Graphs 1920×1080 After Effect 2019+ No Plugin Required Easy to use and Customize Free Customer Support Related Tags: aftereffect animated charts data element explainer graphs infographic survey


 Disable Redirection