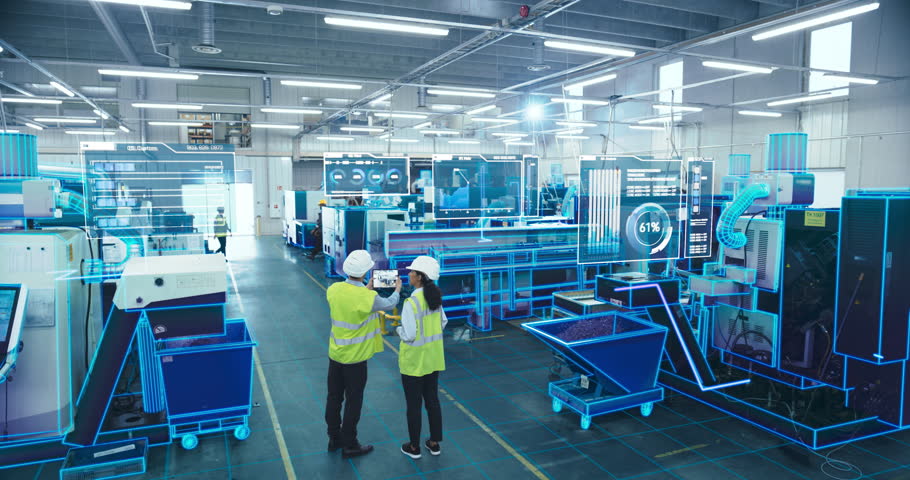
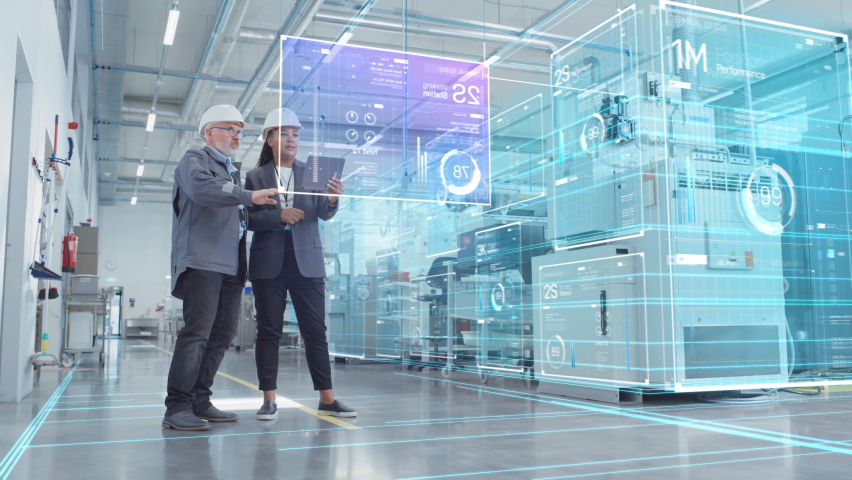
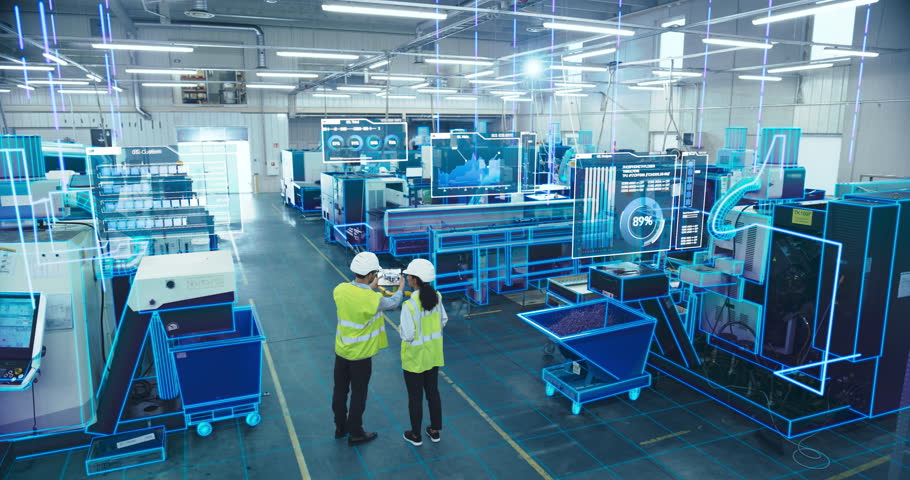
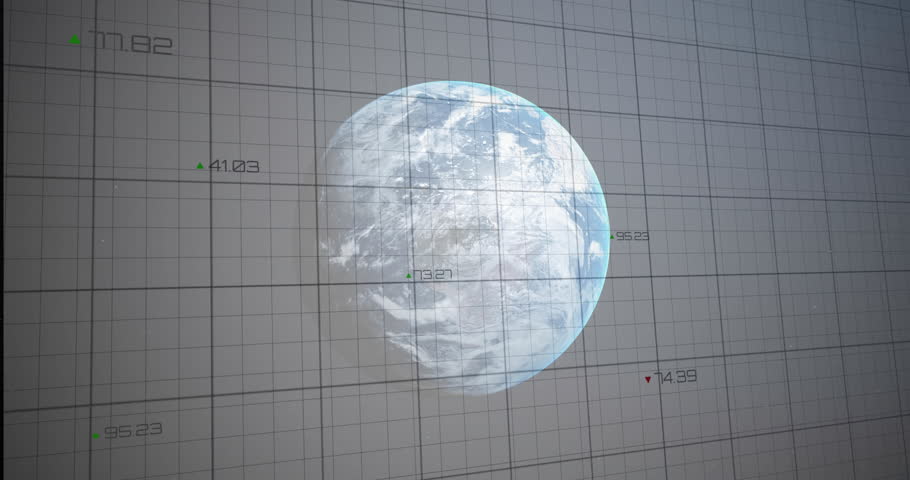
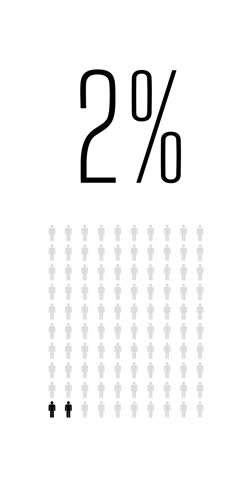
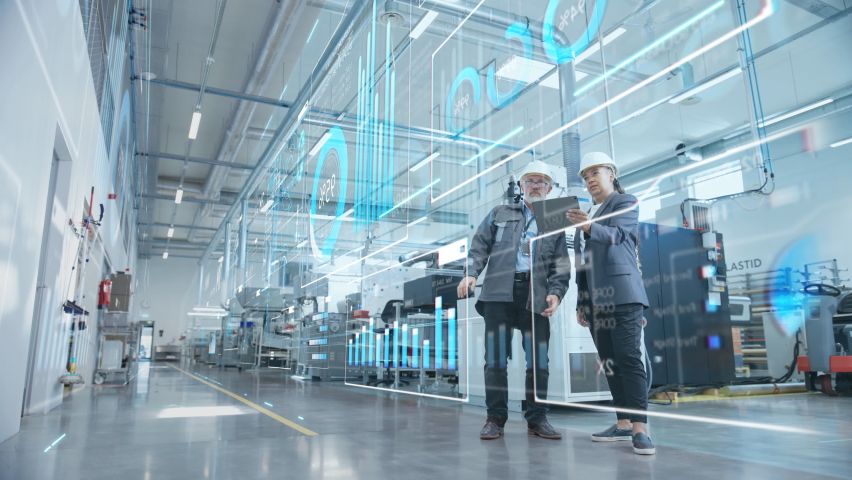
Download Infographic 2 February 22, 2021 Infographics Length 1:36 Resolution 1920 x 1080 File Size 478MB https://video-previews.elements.envatousercontent.com/h264-video-previews/271fdcf4-8f60-4558-b786-3e0bfe9d66f9/20012550.mp4 Download2 Download Buy it Download Disable Redirection Upgrade your account to disable redirection. AIVideoGen BETA Generate immersive scenes with the latest AI models. 16:9 Aspect ratio 16:9 9:16 Sound Speech Generate 5 Man standing at crossroads, facing two different paths with question mark above highlights uncertainty. Making decision. Stop motion, animation. Concept of business, progress, achievement, development Two Engineers in Safety Vests Use a Tablet to Interact With Holographic Data in a High-tech Factory, Activate AI Facility Analysis, Advanced Machinery, Digital Interfaces, Futuristic Manufacturing Factory Digitalization: Two Industrial Engineers Use Tablet Computer, Big Data Statistics Visualization, Optimization of High-Tech Electronics Facility. Industry 4.0 Machinery Manufacturing Products Two Engineers in Safety Gear Use a Tablet to Interact With Holographic Data in a High-tech Factory, Surrounded by Advanced Machinery and Digital Interfaces, Illustrating a Futuristic Manufacturing 3D globe displaying numeric labels then two green lines rising then falling visualizing dual trend. Data, analytics, technology, visualization, animation, digital, infographic Animated elements for bar chart - two groups of vertical data bars 2 percent people infographic, two percentage chart population statistics infinite loopable diagram. 4k vertical black and white animation. Factory Digitalization: Two Industrial Engineers Use Tablet Computer, Visualize the Wall of Big Data Statistics, Optimization of High-Tech Electronics Facility. Industry 4.0 Machinery Production ,Business ,Clean ,Client ,Color ,Company ,Corporate ,Economic ,Enterprise ,Finance ,Financial ,Image ,Infographic ,Presentation ,Report ,Statistics Related Tags: business clean client color company corporate economic enterprise finance financial image infographic presentation report statistics


 Disable Redirection