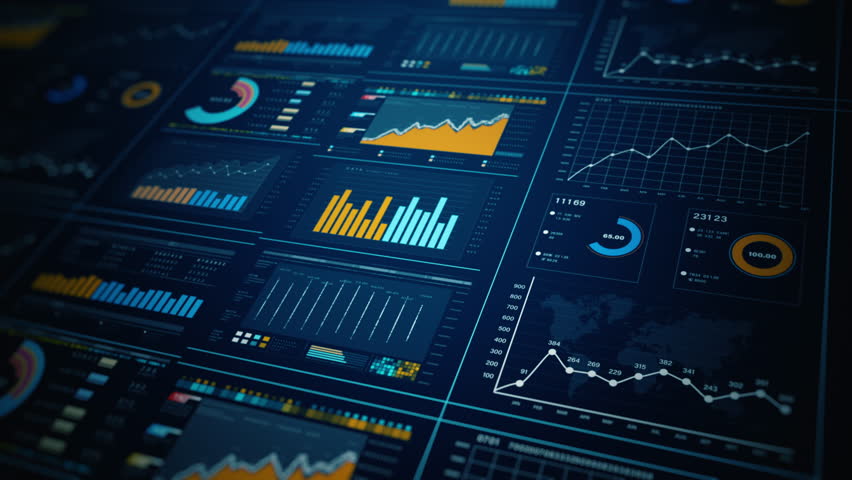
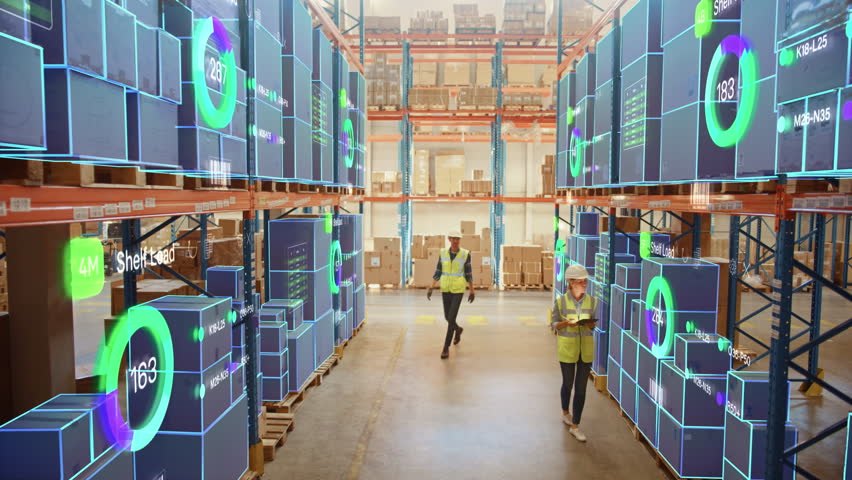
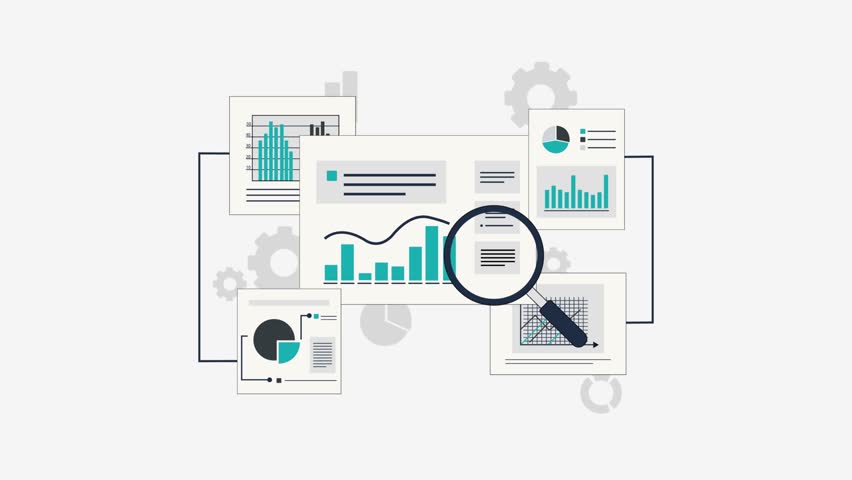
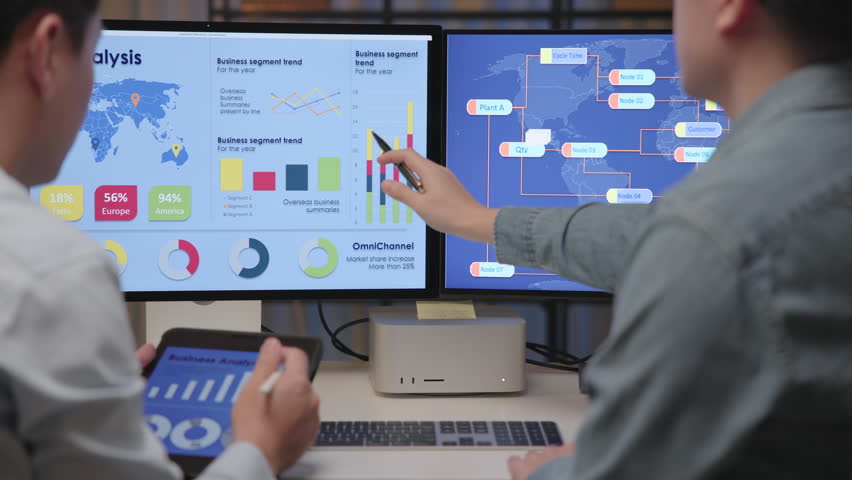
Download Managed Infographic Elements February 22, 2021 Infographics Length 0:50 Resolution 1920 x 1080 File Size 729MB https://video-previews.elements.envatousercontent.com/h264-video-previews/4fb4aacc-9c2a-4e04-a3ac-a196a3cb4af9/24081236.mp4 Download2 Download Buy it Download Disable Redirection Upgrade your account to disable redirection. AIVideoGen BETA Generate immersive scenes with the latest AI models. 16:9 Aspect ratio 16:9 9:16 Sound Speech Generate 5 Advanced data analytics dashboard display. Business and financial investment. HUD infographic of financial. Information reports of business strategy for investment. Technology data analysis. Consulting, finance and infographic on tablet screen with business people in office for investment growth. Data, money and portfolio with financial advisor speaking to client for wealth management Futuristic Business Meeting With Augmented Reality Overlays. Professionals Analyze Holographic Data Projections, Charts, and Percentages on a Table Filled With Documents, Laptops, and Displays. Robotic Vision Concept in a Warehouse: Workers Managing Inventory at Logistics Center. Holographic Data Overlays on Boxes and Providing Insights, AI Optimizing Productivity in a High Tech Environment 4k Data Analytics Information and Monitoring Concept Animation Video A project management meeting and discussing timelines and deliverables, analysing together on company growth goals and gross profit margins investment reports to clients at office table. Asia people expert man tech talent team working on project predict sales insight SEO graph chart AI plan visual big data science report center BI smart tools screen. Office worker asian analyst job. Diverse Team Collaborating with AI Tools in a Modern Office Meeting Room. Top Down View Highlighting Dynamic Interaction and Advanced Technology Integration with Holographic Interfaces ,Business ,Chart ,Corporate ,Data ,Design ,Diagram ,Finance ,Graph ,Icon ,Infographic ,Market ,Presentation ,Startup ,Trading Related Tags: business chart corporate data design diagram finance graph icon infographic market presentation startup trading